My recent post about tuition fees and student loans Pay tuition fees of trainee teachers | John Howson reminded me that it is some years since I compared how trainee teachers were treated in comparison with another group of public servants undergoing training.
British Army officer training at Sandhurst is a 42-week course, slightly longer than the face-to-face component of a PGCE, but I expect that there are few PGCE students that don’t also work during their ‘holidays’, as, indeed, do most teachers.
The key difference, between a PGCE and Sandhurst, apart for the 24 hour seven days a week residential element to army training, is that all officer cadets receive the equivalent of £35,925 per year. I am not sure if this also contains possible pension contributions as well.
Even those PGCE students with bursaries cannot match that figure. The most generous bursaries according to the government website are £29,000 or £31,000 if a trainee is awarded a scholarship. Teacher training bursaries | Get Into Teaching GOV.UK Of course, unlike a salary, these should be tax free during training.
Bursaries are not available to all trainee teachers, only those that the DfE regards as training to be a teacher in a shortage subject. This blog has regularly commented on the somewhat arbitrary and haphazard nature of such designations, including the removal of a bursary for music in September 2026. By contrast, all officer cadets at Sandhurst are paid, regardless of the corps or arm they will eventually join, and whether there are sufficient trainees to staff all required roles.
By comparison, a graduate joining the civil service ‘Fast Stream’ scheme would earn £31,554 per annum, plus a pension and guarantee of employment, something also offered to successful Sandhurst graduates. Fast Stream | Civil Service Careers
I have to say that I think the civil service salary is not very generous, especially for working in central London, but it can increase substantially by year two, so perhaps, it might be seen as a training salary.
Of course, some trainee teachers can earn a salary. Teach First, with its salary, is similar to the civil service Fast Track in blending training and actual ‘real work’. Fast Track currently pays between £23-31,000 for trainees outside London, and up to 333,500 for trainees in London in their first year. Join our leading two-year, fully-funded teacher Training Programme | Teach First So, similar salary to officer cadets at Sandhurst for London trainees on Fast track, but considerably less for those on the Fast Track route outside of London.
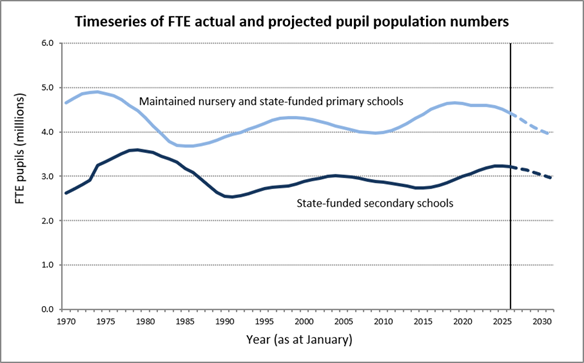
With falling rolls, and better retention rates, the question for the Labour government is whether or not graduate teacher training should be brought into line with other public sector professions, with all trainees receiving a salary plus the guarantee of a teaching post? The latter might be a step too far, but if the government insists on setting training targets trough the Teacher Supply Model, then it should be expected to offer all trainees a teaching post.
Employing trainee teachers, would stop over-recruitment that is costing the government money through paying out student loans, for instance, to the 26% of primary trainees recruited above target last year.
A universal salary scheme for graduate trainee teachers would break the historical bond between trainees and higher education, established when the employer’s training colleges were forced into the higher education sector in the 1970s, following the Robbins Report. Of course, universities could compete to provide the courses for the government alongside other training providers. As they already do for school-based courses.
The present arrangements for graduate teacher training are no longer fit for purpose. The outgoing Prime Minister had little to say about teachers when preparing for government, other than a ‘retention bonus’. Labour’s style over substance | John Howson
I hope that the next Prime Minister, will consider the importance of the teaching workforce in achieving his goals for society. If so, looking at how we train teachers might be a place to start.